 GeoData.NZ
Antarctica New Zealand
Type of resources
Available actions
Topics
Keywords
Contact for the resource
Provided by
Years
Update frequencies
status
-
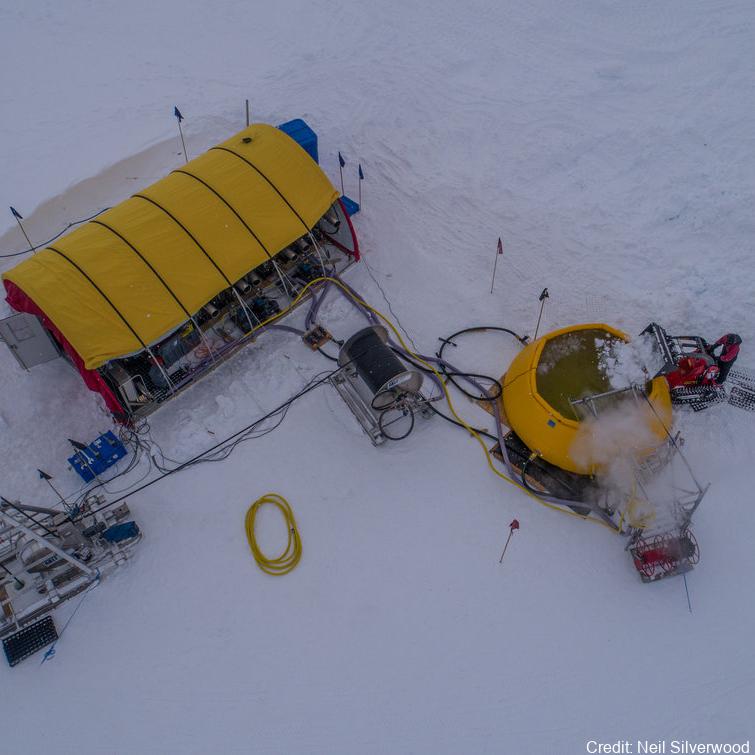
In Antarctica, ice shelves such as the Ross Ice Shelf (RIS) fringe 75% of the coastline and cover over 1.5 million km2, creating distinct and largely unexplored marine environments. It is fundamental to characterize the communities under these shelves to understand their biogeochemical role and predict how they might respond to future ice-shelf collapse 1,2. While historical studies suggested the RIS harbors active microorganisms 3–5, nothing is known about the composition of these communities. In this study, we profiled the composition, function, and activities of microbial communities in three seawater samples (400, 550, 700 m depth) underlying the shelf interior. We combined rate measurements with multi-omics (i.e. single-cell genomics, metagenomics, metatranscriptomics, and metaproteomics). Overall, below-shelf waters harbour microbial communities of comparable abundance and diversity to deep pelagic waters. Based on the meta-omic data, the community is inferred to be sustained by dark carbon fixation using ammonia, nitrite, and sulfur compounds as electron donors. In turn, these chemolithoautotrophs are predicted to support the aerobic heterotrophic majority and various trophic interactions. Consistently, this study and previous activity measurements suggest that dark carbon fixation is sufficient to sustain prokaryotic heterotrophic production, making the waters below the RIS presumably the largest chemolithotrophic system in the global ocean. Further details are provided at https://doi.org/10.1038/s41467-021-27769-5 GET DATA: https://www.ebi.ac.uk/ena/browser/view/PRJEB35712 GET DATA: https://www.ncbi.nlm.nih.gov/bioproject/?term=PRJNA593264
-
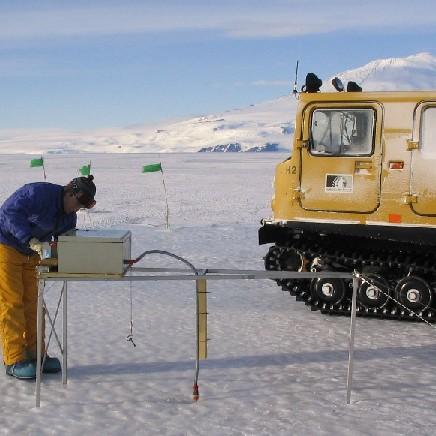
Data provided here have been collected as part of the project "Measurements and Improved Parameterization of the Thermal Conductivity and Heat Flow through First-Year Sea Ice", OPP-0126007* and include measurements of temperature and various ice properties at selected sites in first-year and multiyear sea ice in McMurdo Sound, Antarctica in the years 2002-2004. Data from earlier installations of thermistor chains for measurements of ice temperature carried out by the New Zealand team have also been included. Data files are in Microsoft Excel format, with individual worksheets for specific cores or temperature data sets. Detailed information and comments on data sampling location etc. are provided in the files. Further information on data collection, results etc. can be found in the following publications: Backstrom, L. G. E., and H. Eicken 2007, submitted, Capacitance probe measurements of brine volume and bulk salinity in first-year sea ice, Cold Reg. Sci. Tech. Pringle, D. J., H. Eicken, H. J. Trodahl, and L. G. E. Backstrom 2007, submitted, Thermal conductivity of landfast Antarctic and Arctic sea ice, J. Geophys. Res. Trodahl, H. J., S. O. F. Wilkinson, M. J. McGuinness, and T. G. Haskell 2001, Thermal conductivity of sea ice; dependence on temperature and depth, Geophys. Res. Lett., 28, 1279-1282. Data are in Microsoft Excel format. Abbreviations: AH = Arrival Heights; CH = Camp Haskell (near Delbridge Islands); VUW = Victoria University Wellington; UAF = University Alaska Fairbanks. RELATED PUBLICATION: https://doi.org/10.1017/jog.2022.108 GET DATA: https://drive.google.com/drive/folders/1ooUH9dPvWT66afFC51Cb0JOHg66rn0sy
-
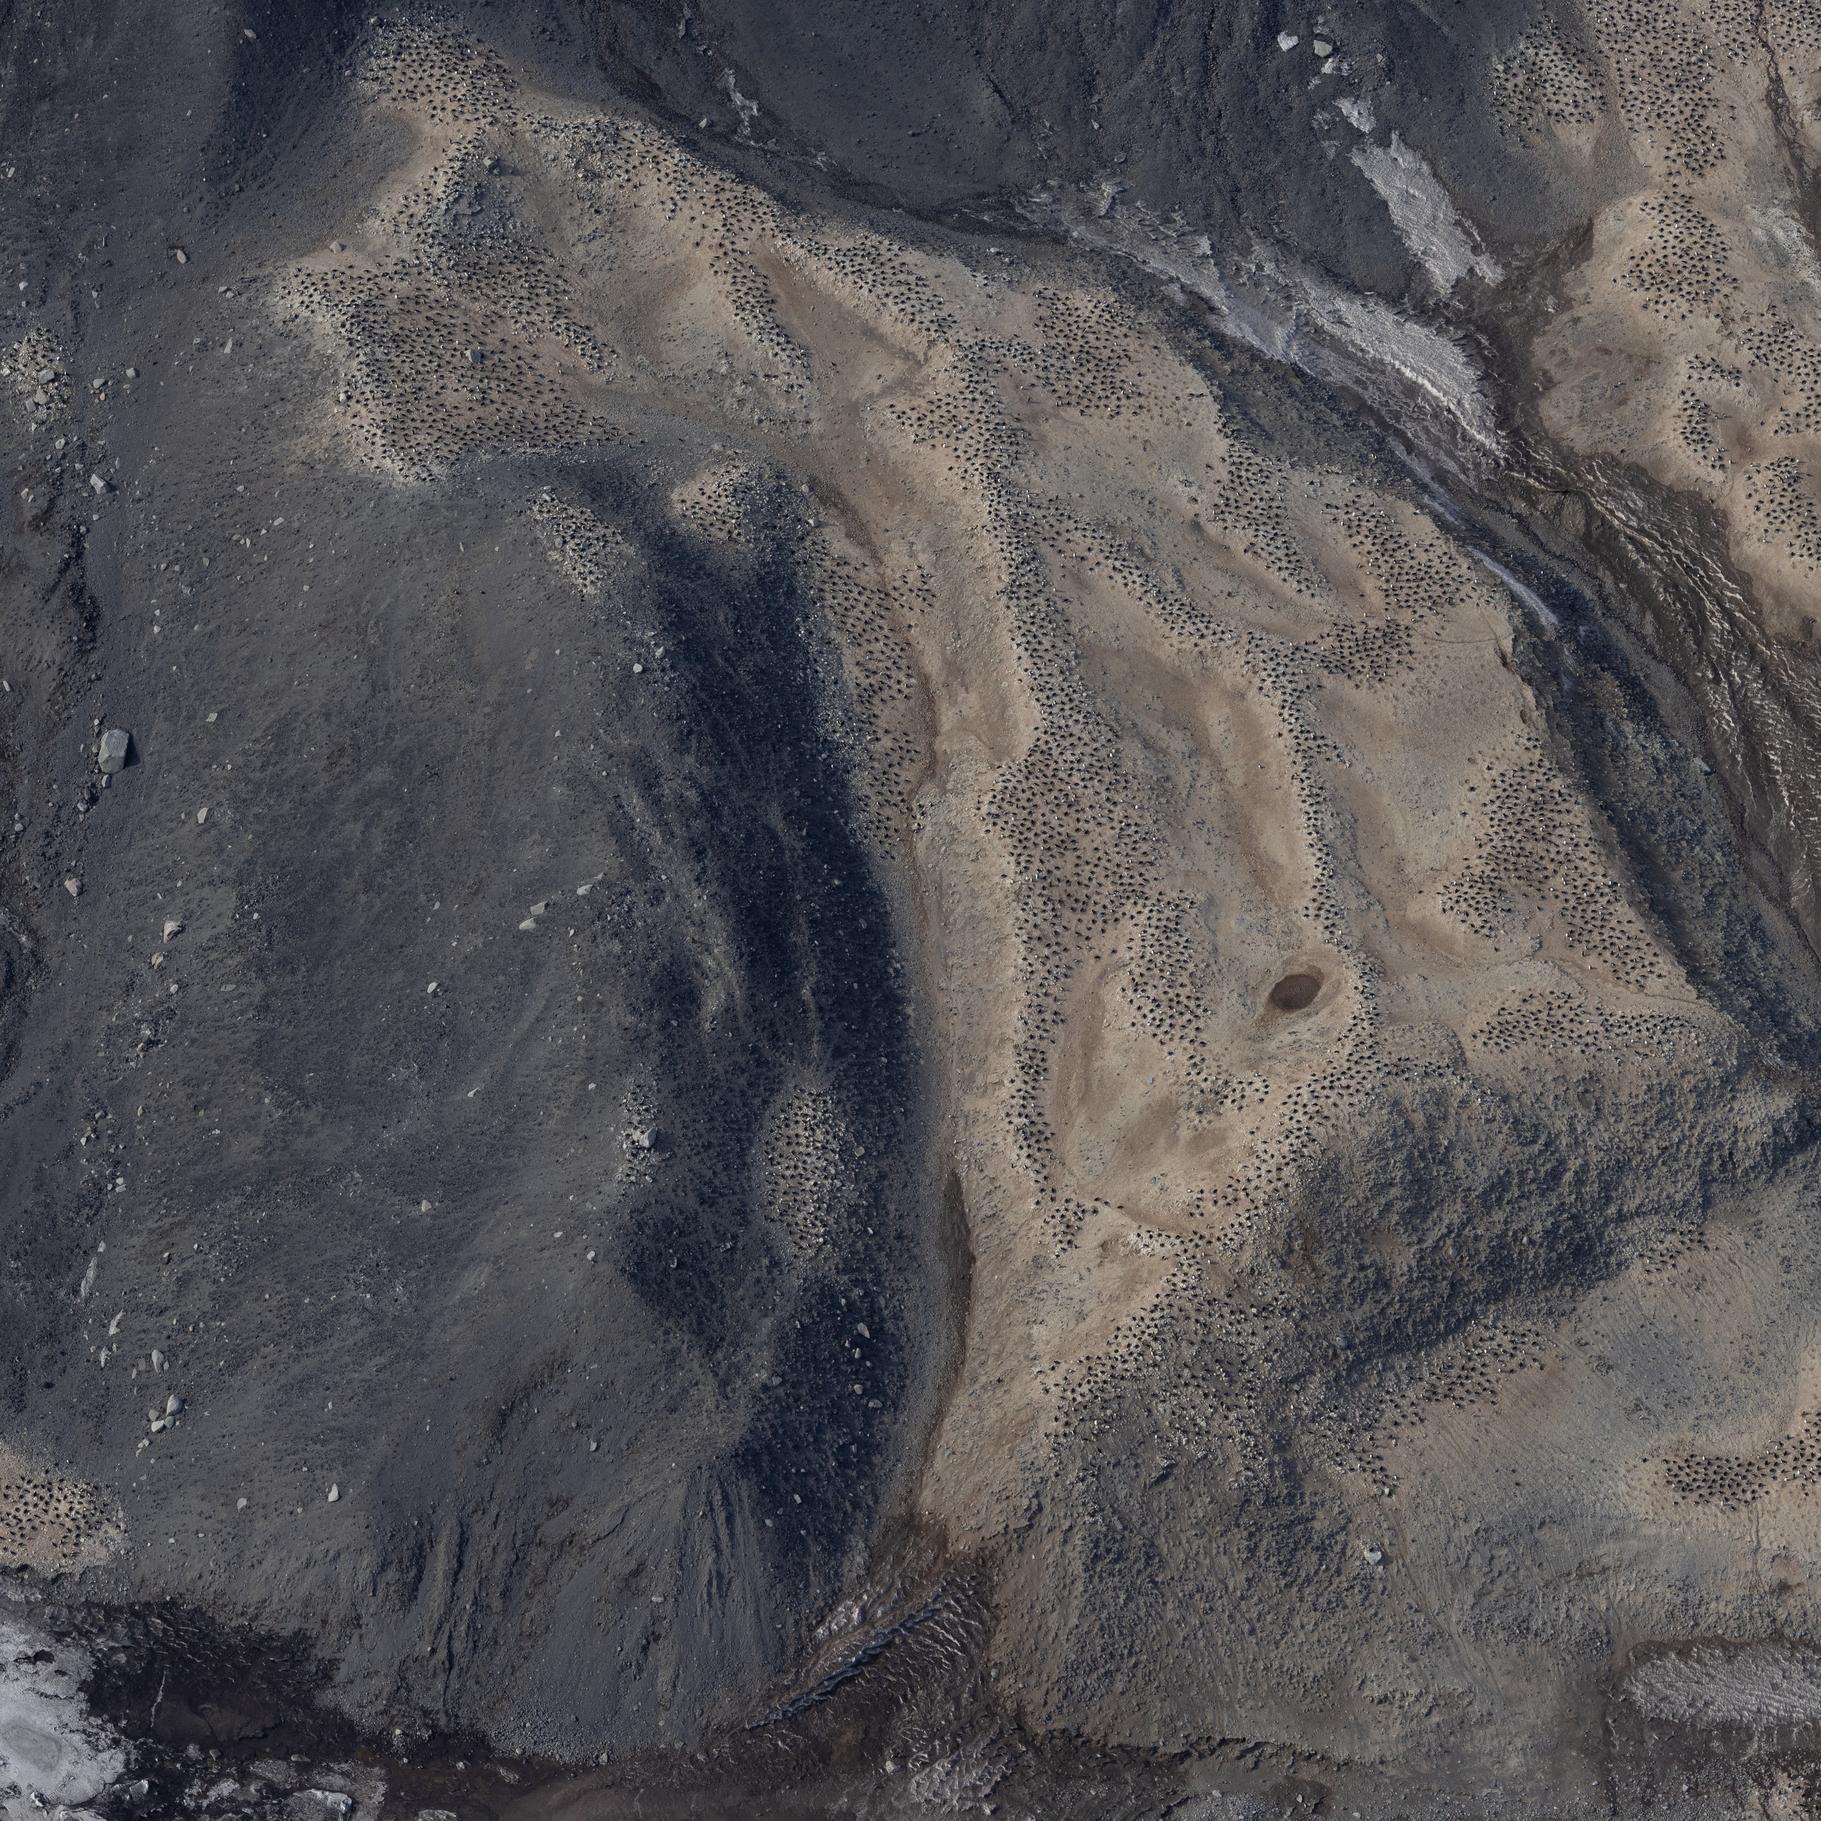
Raw images (over approximately 20.000 unique images) collected during the Adelie Penguin Census across 30+ colonies since 1981 (see associated metadata resource for list full list of colonies). Photographs were taken using a black and white film camera from 1981 to 2004 (inclusive) and 2008. Images are available in .tif fomrat. Images are digital from 2005 onwards (except 2008). Raw images are available in cr2/cr3 formats, and processed images are available across tif and jpg formats. High resolution scanning was initiated in 2011 to scan all the negatives in the collection. There are approximately 10,000 negatives in the collection. Images are taken from helicopter at between 2000-2500 feet. All images collected during the 2324 season are georeferenced with latitude and longitude positions in decimal degrees (WGS 84). Camera Settings: ISO = 400 Shutter speed = greater than 1/1000 Focus = manual, pre-focus to 800m Lens = 135mm with UV filter Aperture/ Exposure = F8 (or up to F11) Image Size = Full size White Balance Setting = Daylight Captures per minute = ~80 GET DATA: m.meredyth-young@antarcticanz.govt.nz
-
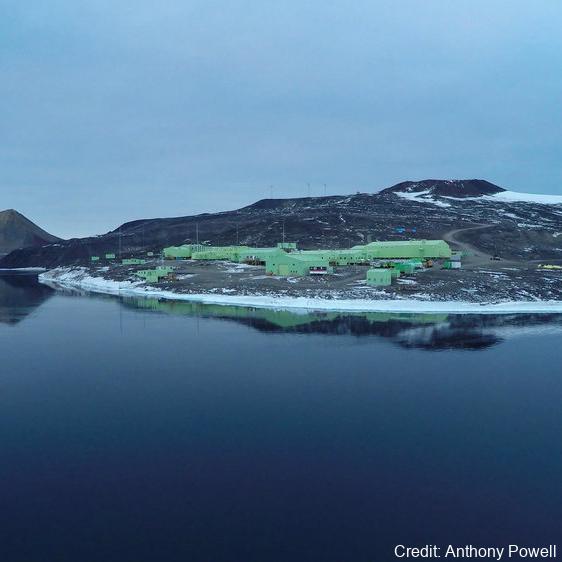
As part of the Scott Base Redevelopment Marine Monitoring Programme, the impact of Scott Base's activities on the local marine environment was assessed. Sampling took place at three sites around Hut Point Peninsula on the southern half of Ross Island during October – November 2019 to assess anthropogenic contamination. Two acoustic doppler current profilers (ADCP; Nortek Signature 500) were deployed, and set with a 2-minute sampling period in 1m vertical depth bins from the seabed to the underside of the ice. Instrument heads were kept ~0.5 m beneath the under-surface. ADCP data were downloaded, extracted from their raw formats, and averaged into 10-minute intervals. A magnetic declination of 141.09° E was applied to the measured current direction to correct the readings to reflect true north and a pressure offset was applied to standardise depths relative to ambient air pressure at the seawater surface. Information on habitats and benthic epifauna assemblage composition were collected using high resolution video across 2 25m transects at ~22m depth. Multiple overlapping passes were made across the seabed transects at ~0.5 m depth contours between ~20 – 26 m in order to create a 2D orthomosaic image of each site. Analysis of the diver-collected video was done using individual frames. The video along each transect was divided into 10 equal time segments and still frames were taken at random from the first, third, fifth, seventh and ninth segments. Eight video frames were analysed per transect (i.e., n=8 per transect and n=16 per site) by one individual to minimise observer bias. Sediment samples were collected by divers to determine contaminant concentrations and sediment characteristics (sediment particle size composition, organic matter content, organic carbon content and algal pigment content) at each site. Sponge species (Sphaerotylus antarcticus and Laternula elliptica) were collected for tissue contaminant analysis. Full description of methods is available at: https://doi.org/10.1007/s00300-023-03181-1 GET DATA: drew.lohrer@niwa.co.nz
-
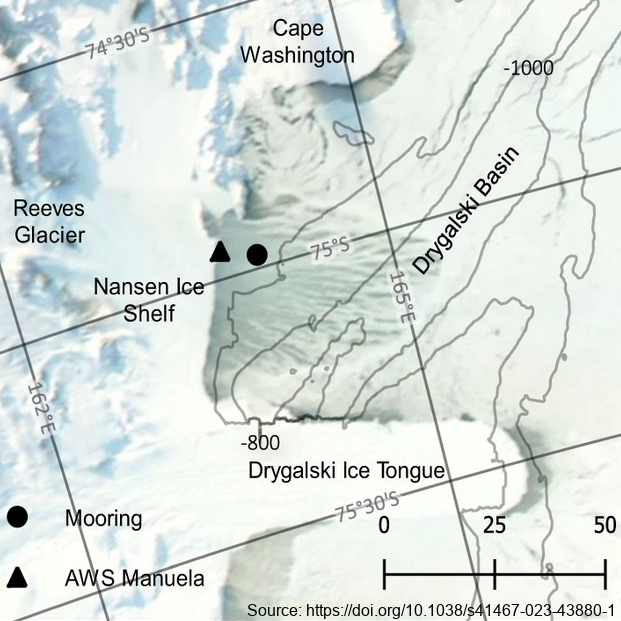
The mooring was deployed from February 2017 through February 2018 at 74.97° S, 163.96° E, approximately 7km east of the Nansen Ice Shelf in a region of TNB. The purpose of this study was to utilize data from a uniquely positioned and densely instrumented mooring to calculate HSSW production rates in TNB from continuous, in-situ observations. Moored instrumentation consisted of 7 SeaBird Electronics conductivity and temperature (SBE37-SM/SMP MicroCAT) sensors at depths of 47, 95, 119, 144, 168, 219, and 360 m and an upward-facing 600 kHz Nortek Acoustic Wave and Current (AWAC) profiler at 37 m depth, collecting both current velocity profiles in the upper ~35 m of the water column as well as Acoustic Surface Tracking (AST) measurements. Temperature and salinity measurements were validated against a shipboard conductivity-temperature-depth (CTD) cast performed upon deployment of the mooring. Temperature and salinity at 47 m and 95 m were additionally validated against a CTD cast performed upon recovery of the mooring. Full details of methods can be found in https://doi.org/10.1038/s41467-023-43880-1 GET DATA: ukm2103@columbia.edu
-
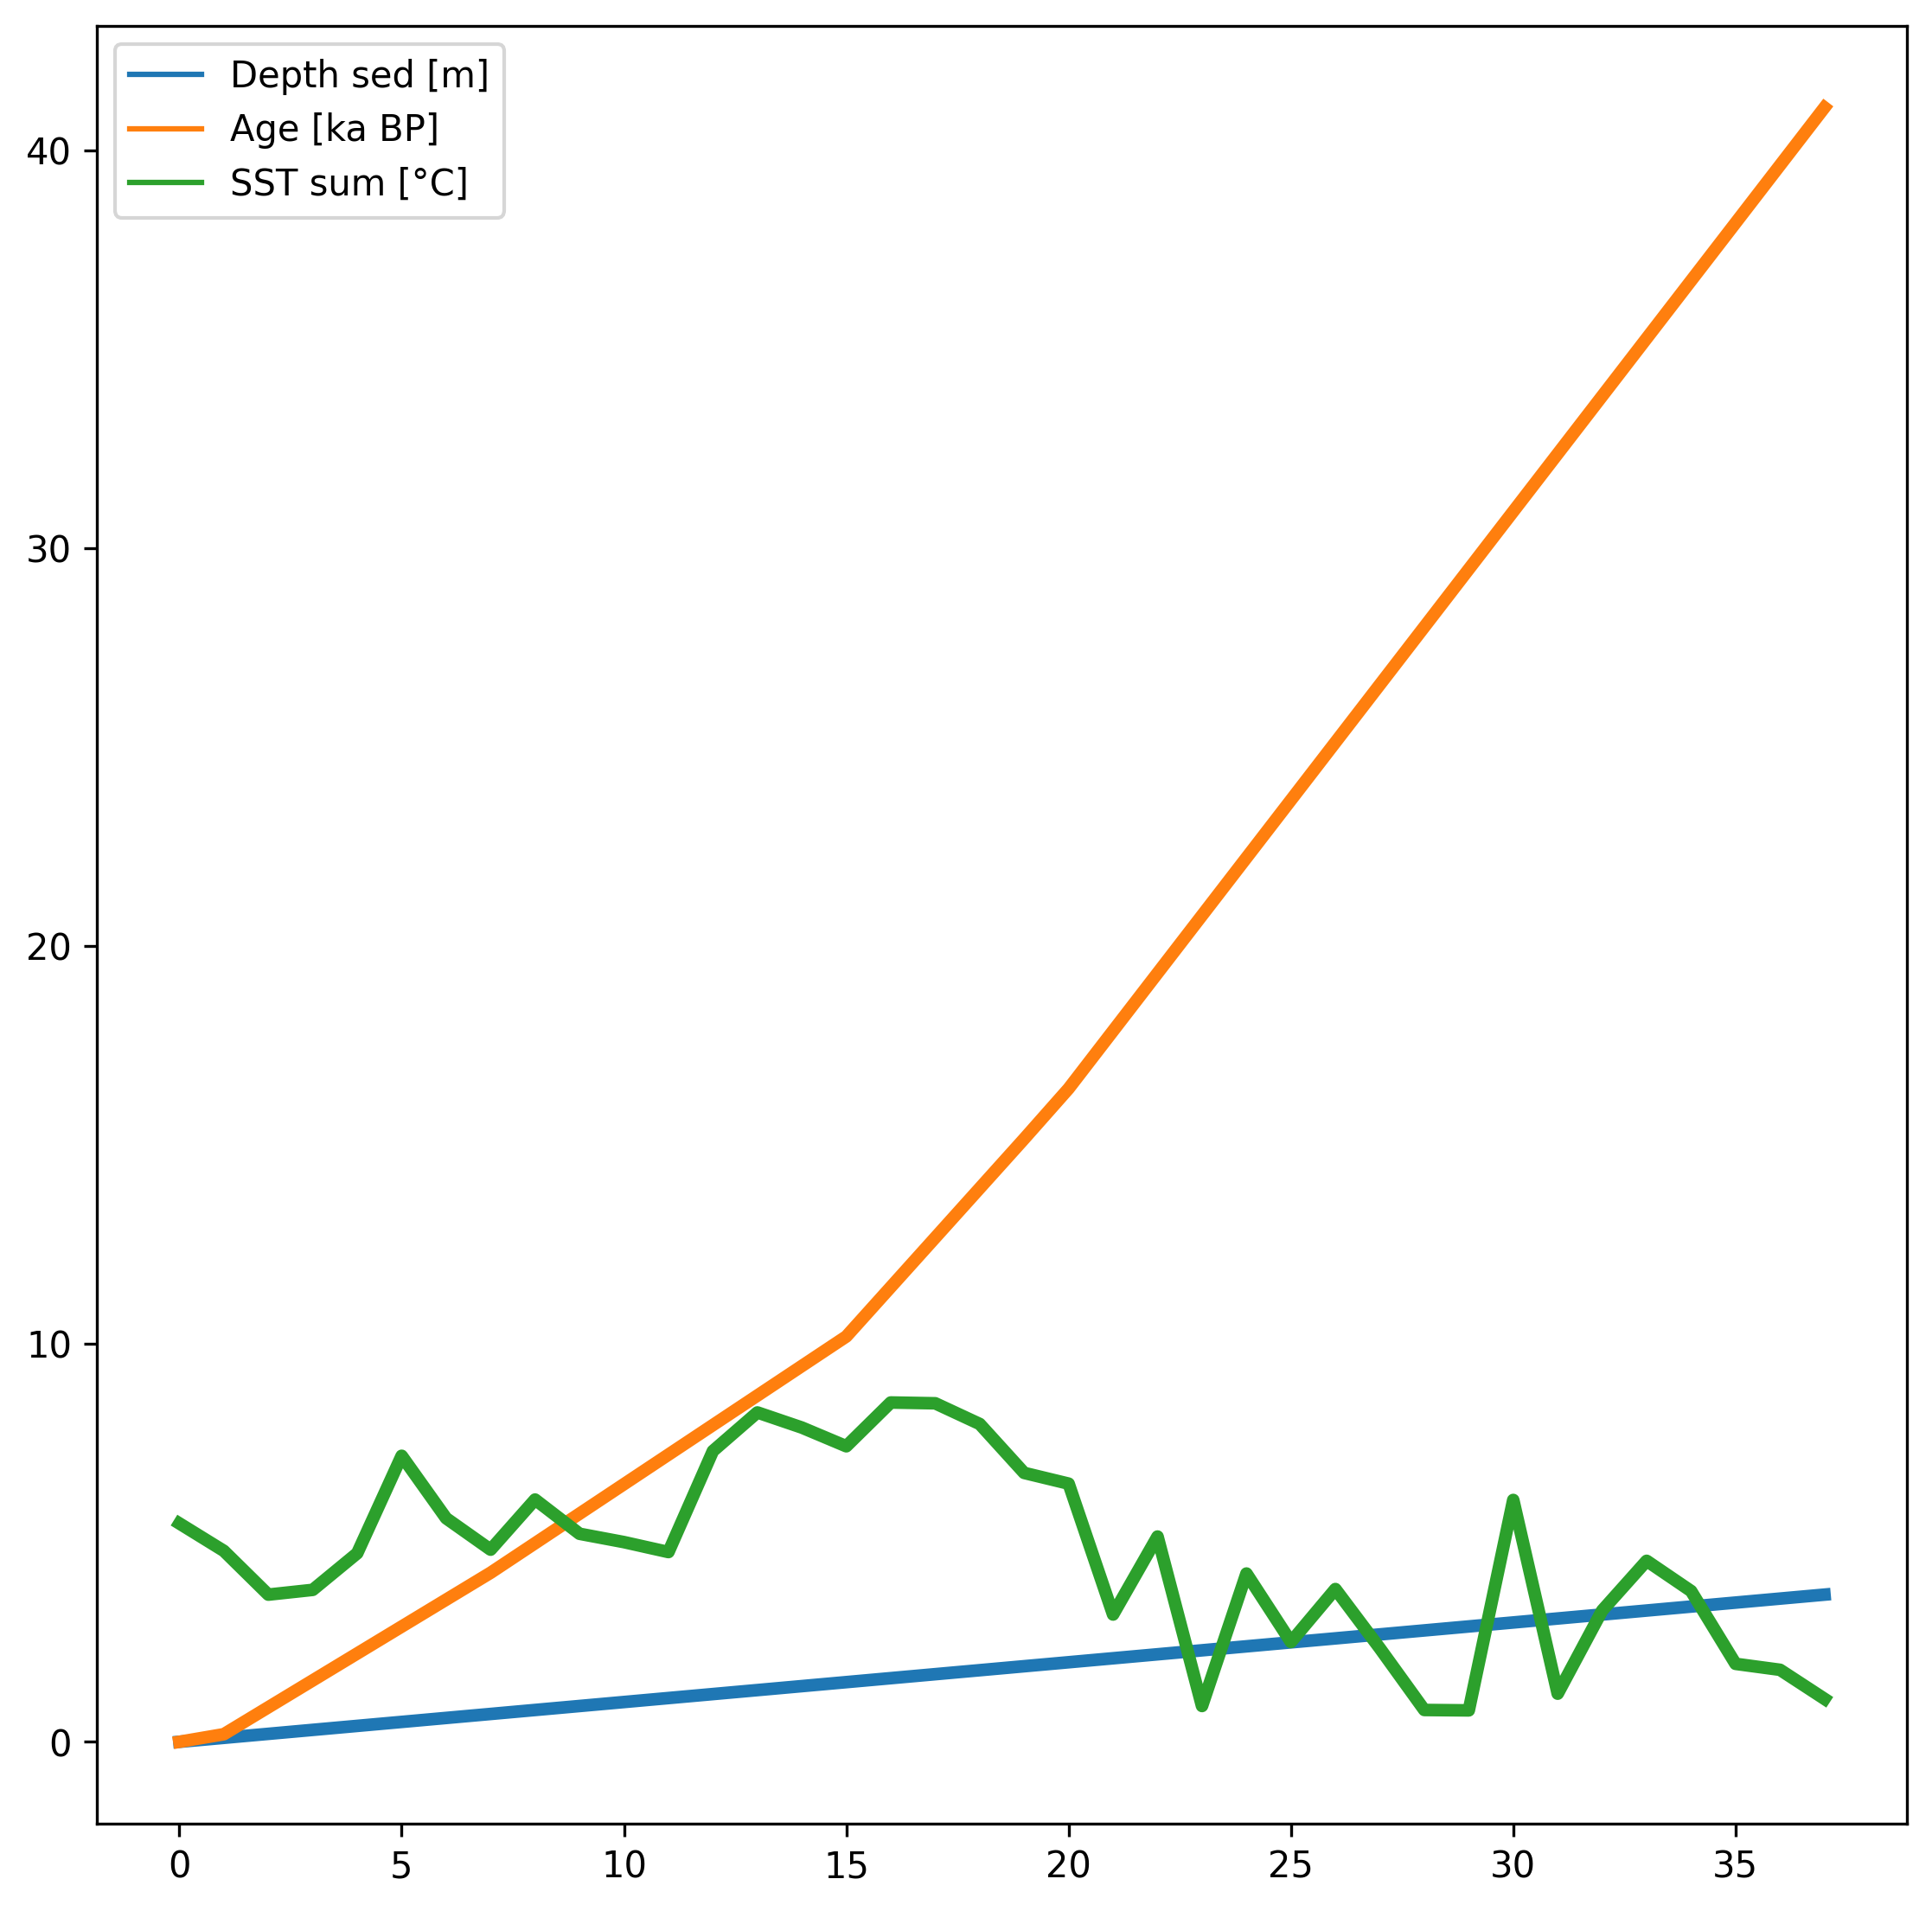
Diatom census counts were used to quantitatively estimate summer sea-surface temperatures (SST) over the last 40,000 years in core MD11-3353, collected in 2011 on board the R.V. Marion Dusfresne west of Kerguelen Island, Southern Ocean. The transfer function used to reconstruct summer (January to March) SST is the Modern Analog Technique that here uses 249 surface sediment samples (modern analogs), the relative abundances of 32 diatom species and the chord distance to select the five most similar modern analogs (Crosta et al., 2020). This method yields a root mean square error of prediction of ~1 °C. The core chronology is detailed in Thöle et al. (2019). RELATED PUBLICATION: Civel-Mazens, Matthieu; Crosta, Xavier; Cortese, Giuseppe; Michel, Elisabeth; Mazaud, Alain; Ther, Olivier; Ikehara, Minoru; Itaki, Takuya (2021): Impact of the Agulhas Return Current on the oceanography of the Kerguelen Plateau region, Southern Ocean, over the last 40 kyrs. Quaternary Science Reviews, 251, 106711, https://doi.org/10.1016/j.quascirev.2020.106711
-
Sea ice temperature (°C) measured across multiple depths at (LATITUDE: -77.792300, LONGITUDE: 166.514900). RELATED PUBLICATION: https://doi.org/10.1017/jog.2022.108 GET DATA: https://doi.org/10.1594/PANGAEA.880164
-
Sea ice temperature (°C) measured across multiple depths at (LATITUDE: -77.794900, LONGITUDE: 166.334700). RELATED PUBLICATION: https://doi.org/10.1017/jog.2022.108 GET DATA: https://doi.org/10.1594/PANGAEA.880165
-
Sea ice temperature (°C) measured across 11 depths (57 cm, 78.5 cm, 84.5 cm, 87.5 cm, 96.5 cm, 105.5 cm, 108.5 cm, 114.5 cm, 117.5 cm, 120.5 cm, 129.5 cm) at (LATITUDE: -77.781700, LONGITUDE: 166.315300): RELATED PUBLICATION: https://doi.org/10.1017/jog.2022.108
-
Here, we present a decadally resolved record of sea-salt sodium (a proxy for open-ocean area) and non-sea salt calcium (a proxy for continental dust) from the well-dated Roosevelt Island Climate Evolution (RICE) core, focusing on the time period between 40–26 ka BP. Drilling site coordinates: (79.364° S, 161.706°W). Further collection details can be found at https://doi.org/10.1038/s41467-023-40951-1